Profiling Java with JFR or Async-Profiler
At some stage you will in need of do some profiling on your Java application to understand a bit more about
- What method is using so much CPU?
- What objects are taking up so much memory?
- How many threads are there and what are they doing?
Recently I have been trying to profile my Java application with tools such as JFR (Java Flight Recorder) and Java-Async-Profiler.
Both seems working well, most cases they don’t need you to start your Java Application in any special way. Simply ssh onto your production instances you can easily do some profiling with those tools.
However here is some major differences in my opinion:
- JFR seems only working for Java 11 applications
- Java-Async-Profiler works for both Java 8 and 11, but it seems providing less info than JFR.
JFR
Firstly you need a tool called JMC to view JFR results, and I heard that you can download them from
- https://builds.shipilev.net/jmc/
- https://www.azul.com/products/zulu-mission-control/
Note that some of the latest build can’t be able to start on my mac so I had to download some older build. Like one from 2019-Sep worked for me.
Then basic step to do profiling or recording is to
- ssh to an instance
- If your app runs in docker,then enter the container:
docker exec -it 51724efa7242 /bin/bashand cd into a directory the host have access to - If your app runs in kubernetes containers:
kubectl exec -it podname-6d5c9b495d-5v4r6 bash jcmdto see your application java process number, for example1- Start a recording:
jcmd 1 JFR.startNoticing the outputStarted recording 1. No limit specified, using maxsize=250MB as default. - Wait a minute or so
- Dump the recording to file:
jcmd 1 JFR.dump name=1 filename=/tmp/foobar.jfr - Stop the recording (if you are done):
jcmd 1 JFR.stop name=1 - Exit ssh shell and use scp the file
foobar.jfrto your laptop - Then you can load the file into the JMC application downloaded above to view your profile
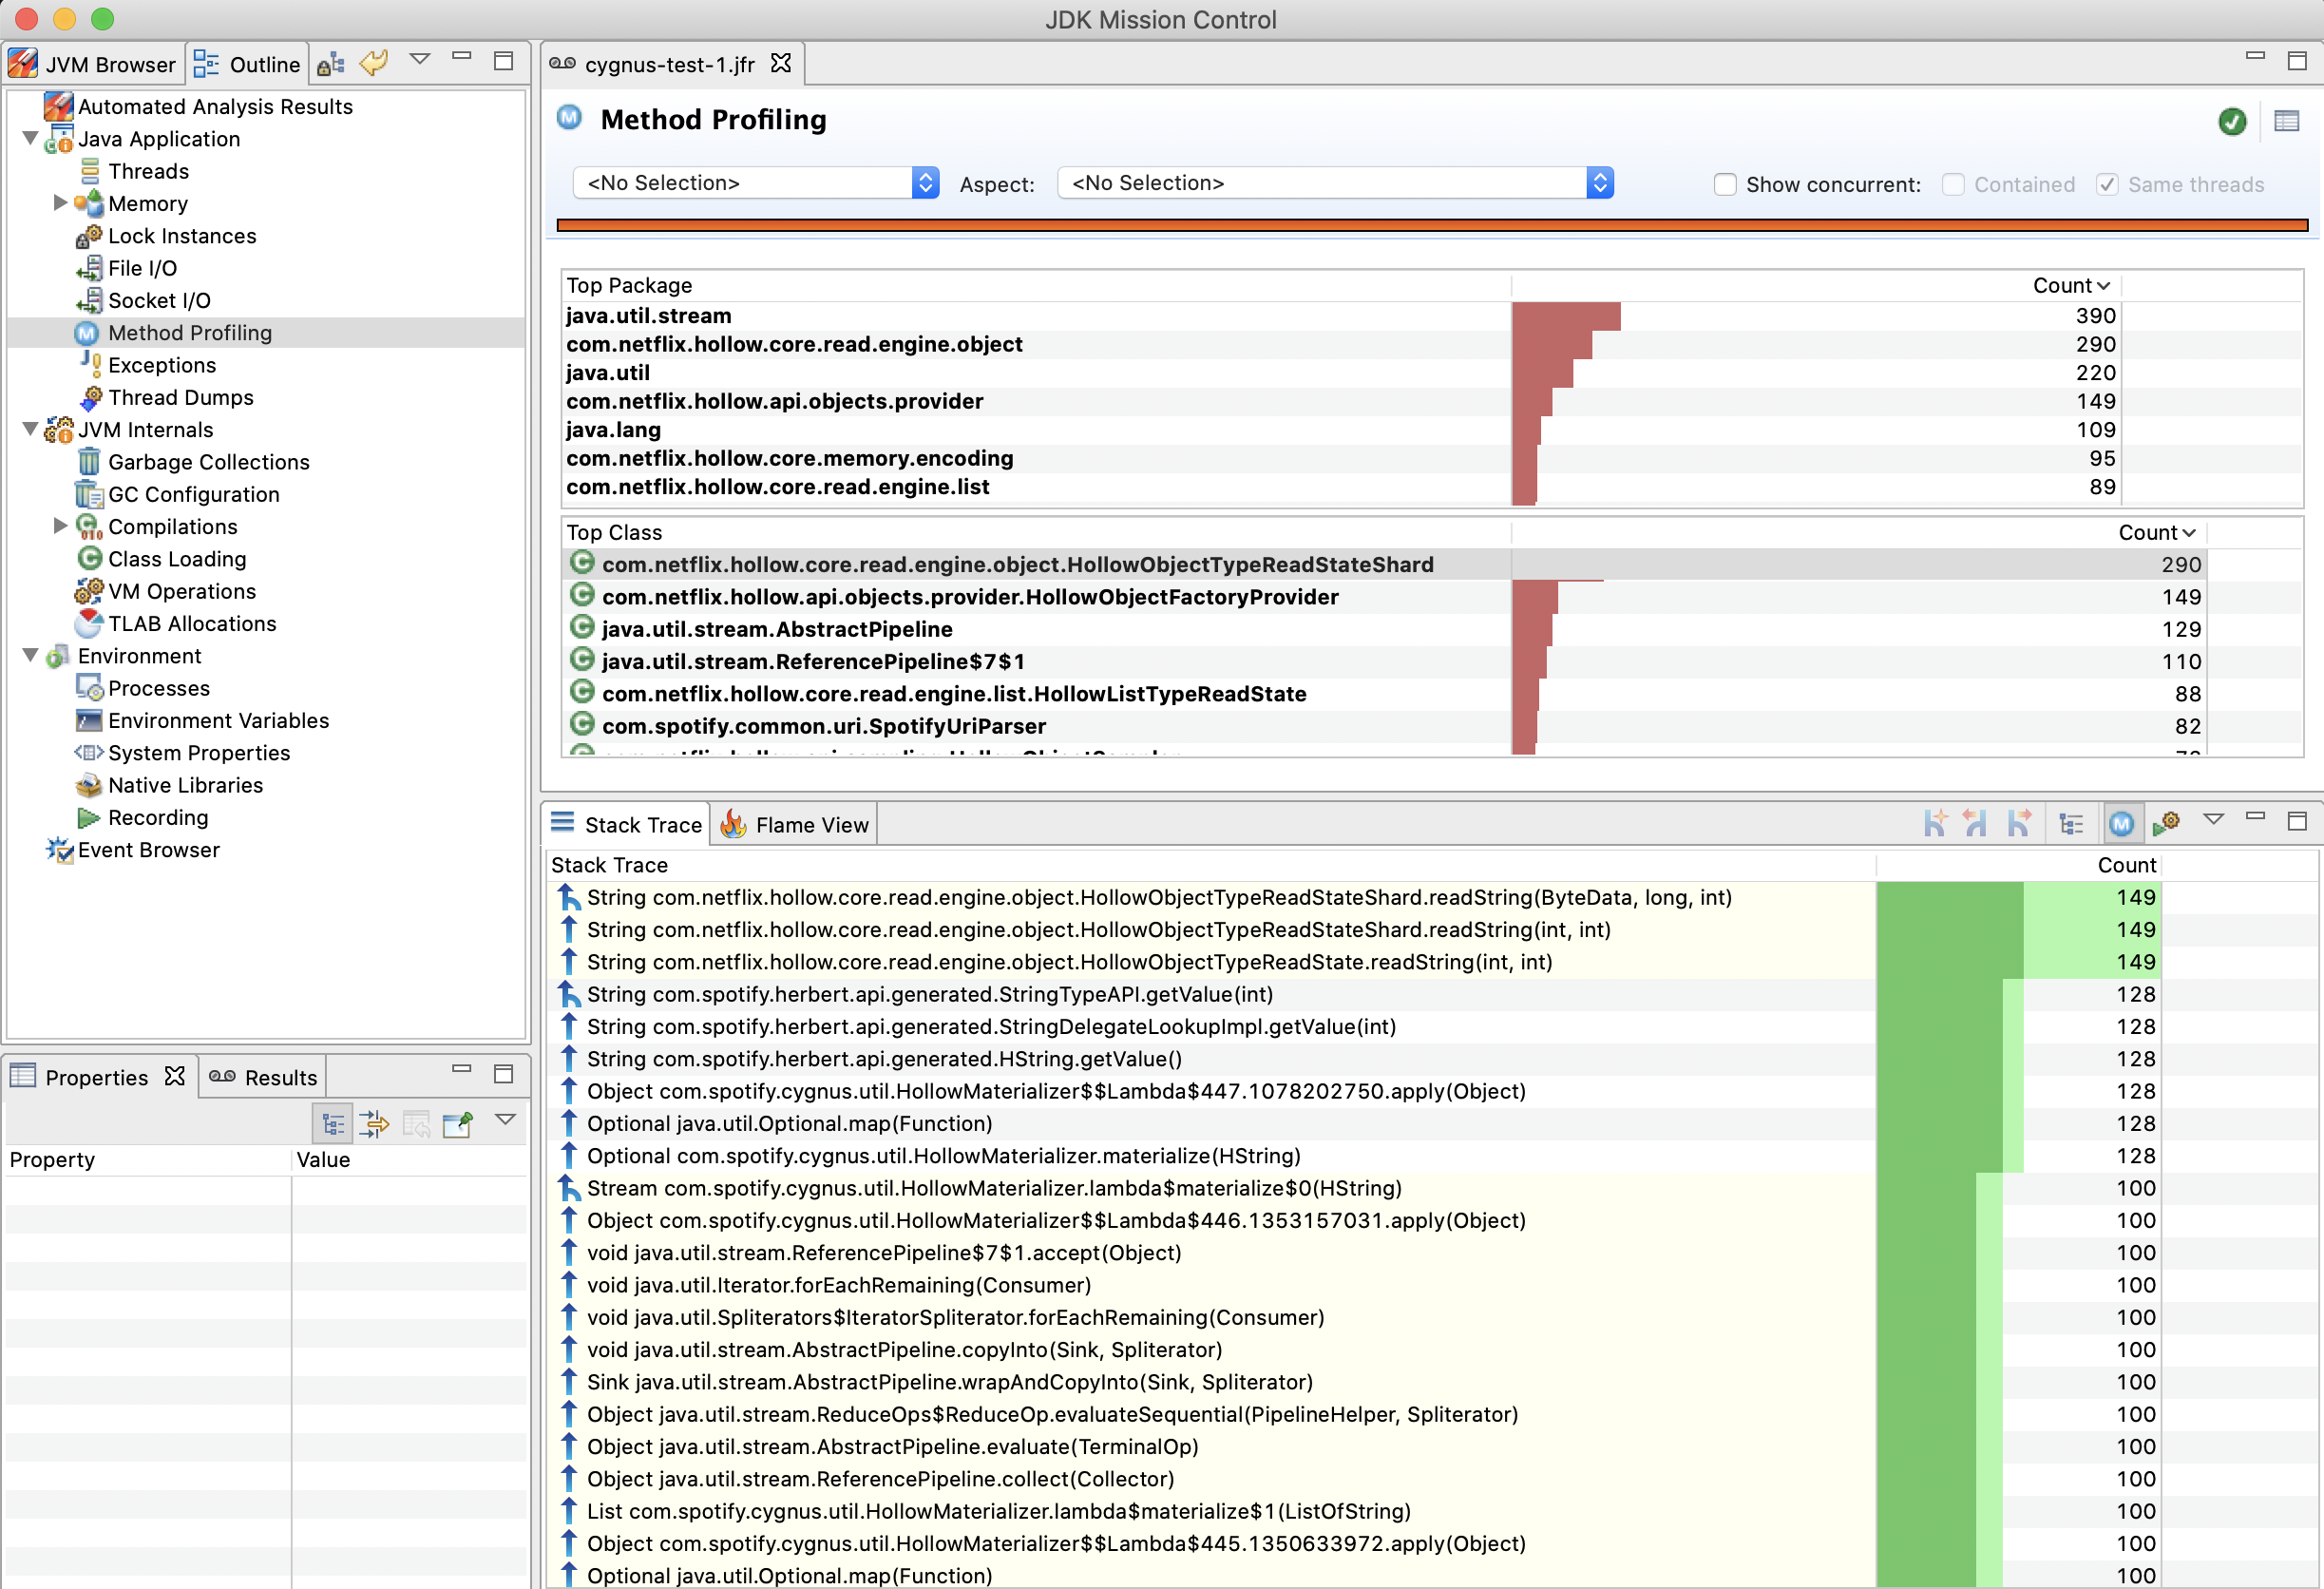
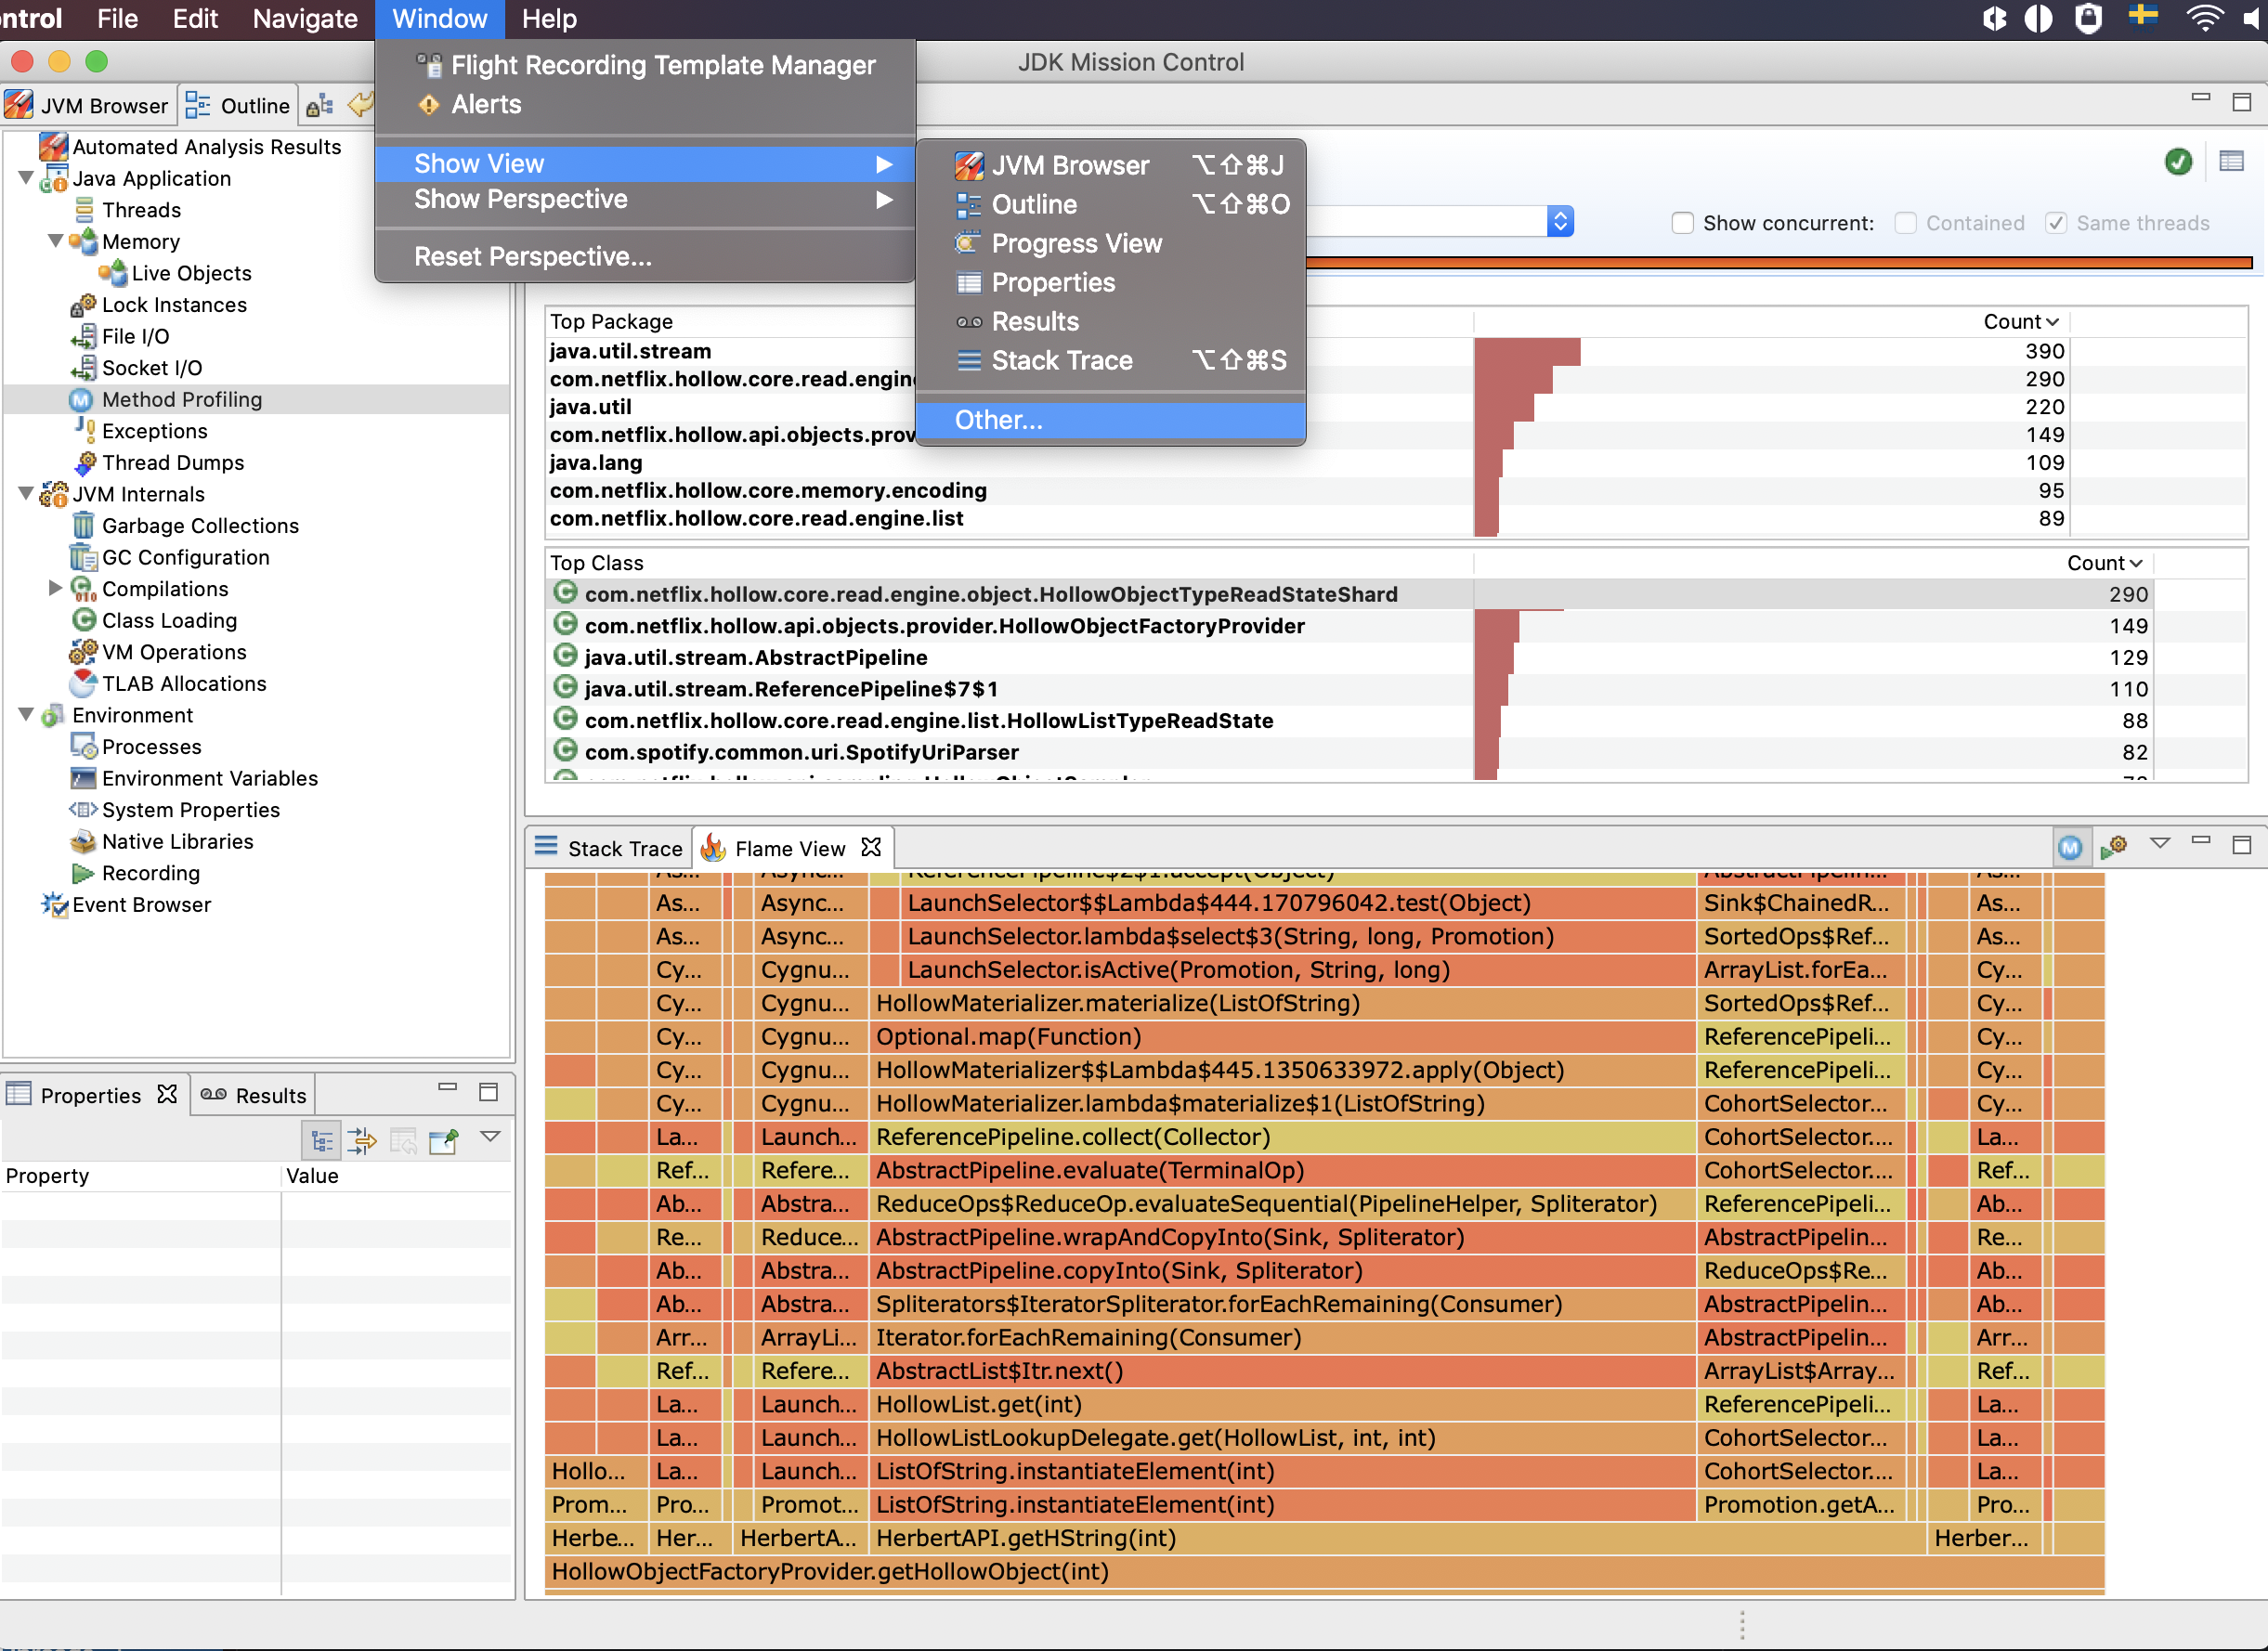
Noticing there is a flame graph you can view as well by open it with “Window” -> “Show View” -> “Other…” -> “Flame graph”.
One issue I am not sure why is that it seems the memory object profiler is not working for me and I don’t see any classes in the memory view. Will keep post updated later on if I learn something new about it.
Java-Async-Profiler
Java-Async-Profiler is also very easy to use as well.
- Firstly download the package file from https://github.com/jvm-profiling-tools/async-profiler and unzip it locally.
scpthe folderasync-profiler-1.6-linux-x64onto the instance you want to profile- If your app is in kubernetes, do like
kubectl cp Downloads/async-profiler-1.6-linux-x64 somepod-6d5c9b495d-5v4r6:/tmp/ sshorkubectl exec -it ...into your instance or container, cd intoasync-profiler-1.6-linux-x64-
It is possible to profile Java processes running in Docker or LXC container both from within a container and from the host system.
When profiling from the host, pid should be the Java process ID in the host namespace. Use
ps aux | grep javaordocker top <container>to find the process ID. Let’s say it is20891When profiling inside the container, use
jcmdcommand described above to show the Java process id. - Command to start profile
./profiler.sh -d 30 20891 -
If not working, try from inside docker
docker exec -it 75a8f7d9d1c3 bashjcmd./profiler.sh -d 30 10 -
If still not working, try
-e itimer./profiler.sh -d 30 -e itimer 10Otherwise, according to the doc, you would need to set
/proc/sys/kernel/perf_event_paranoid = 1and/proc/sys/kernel/kptr_restrict=0. -
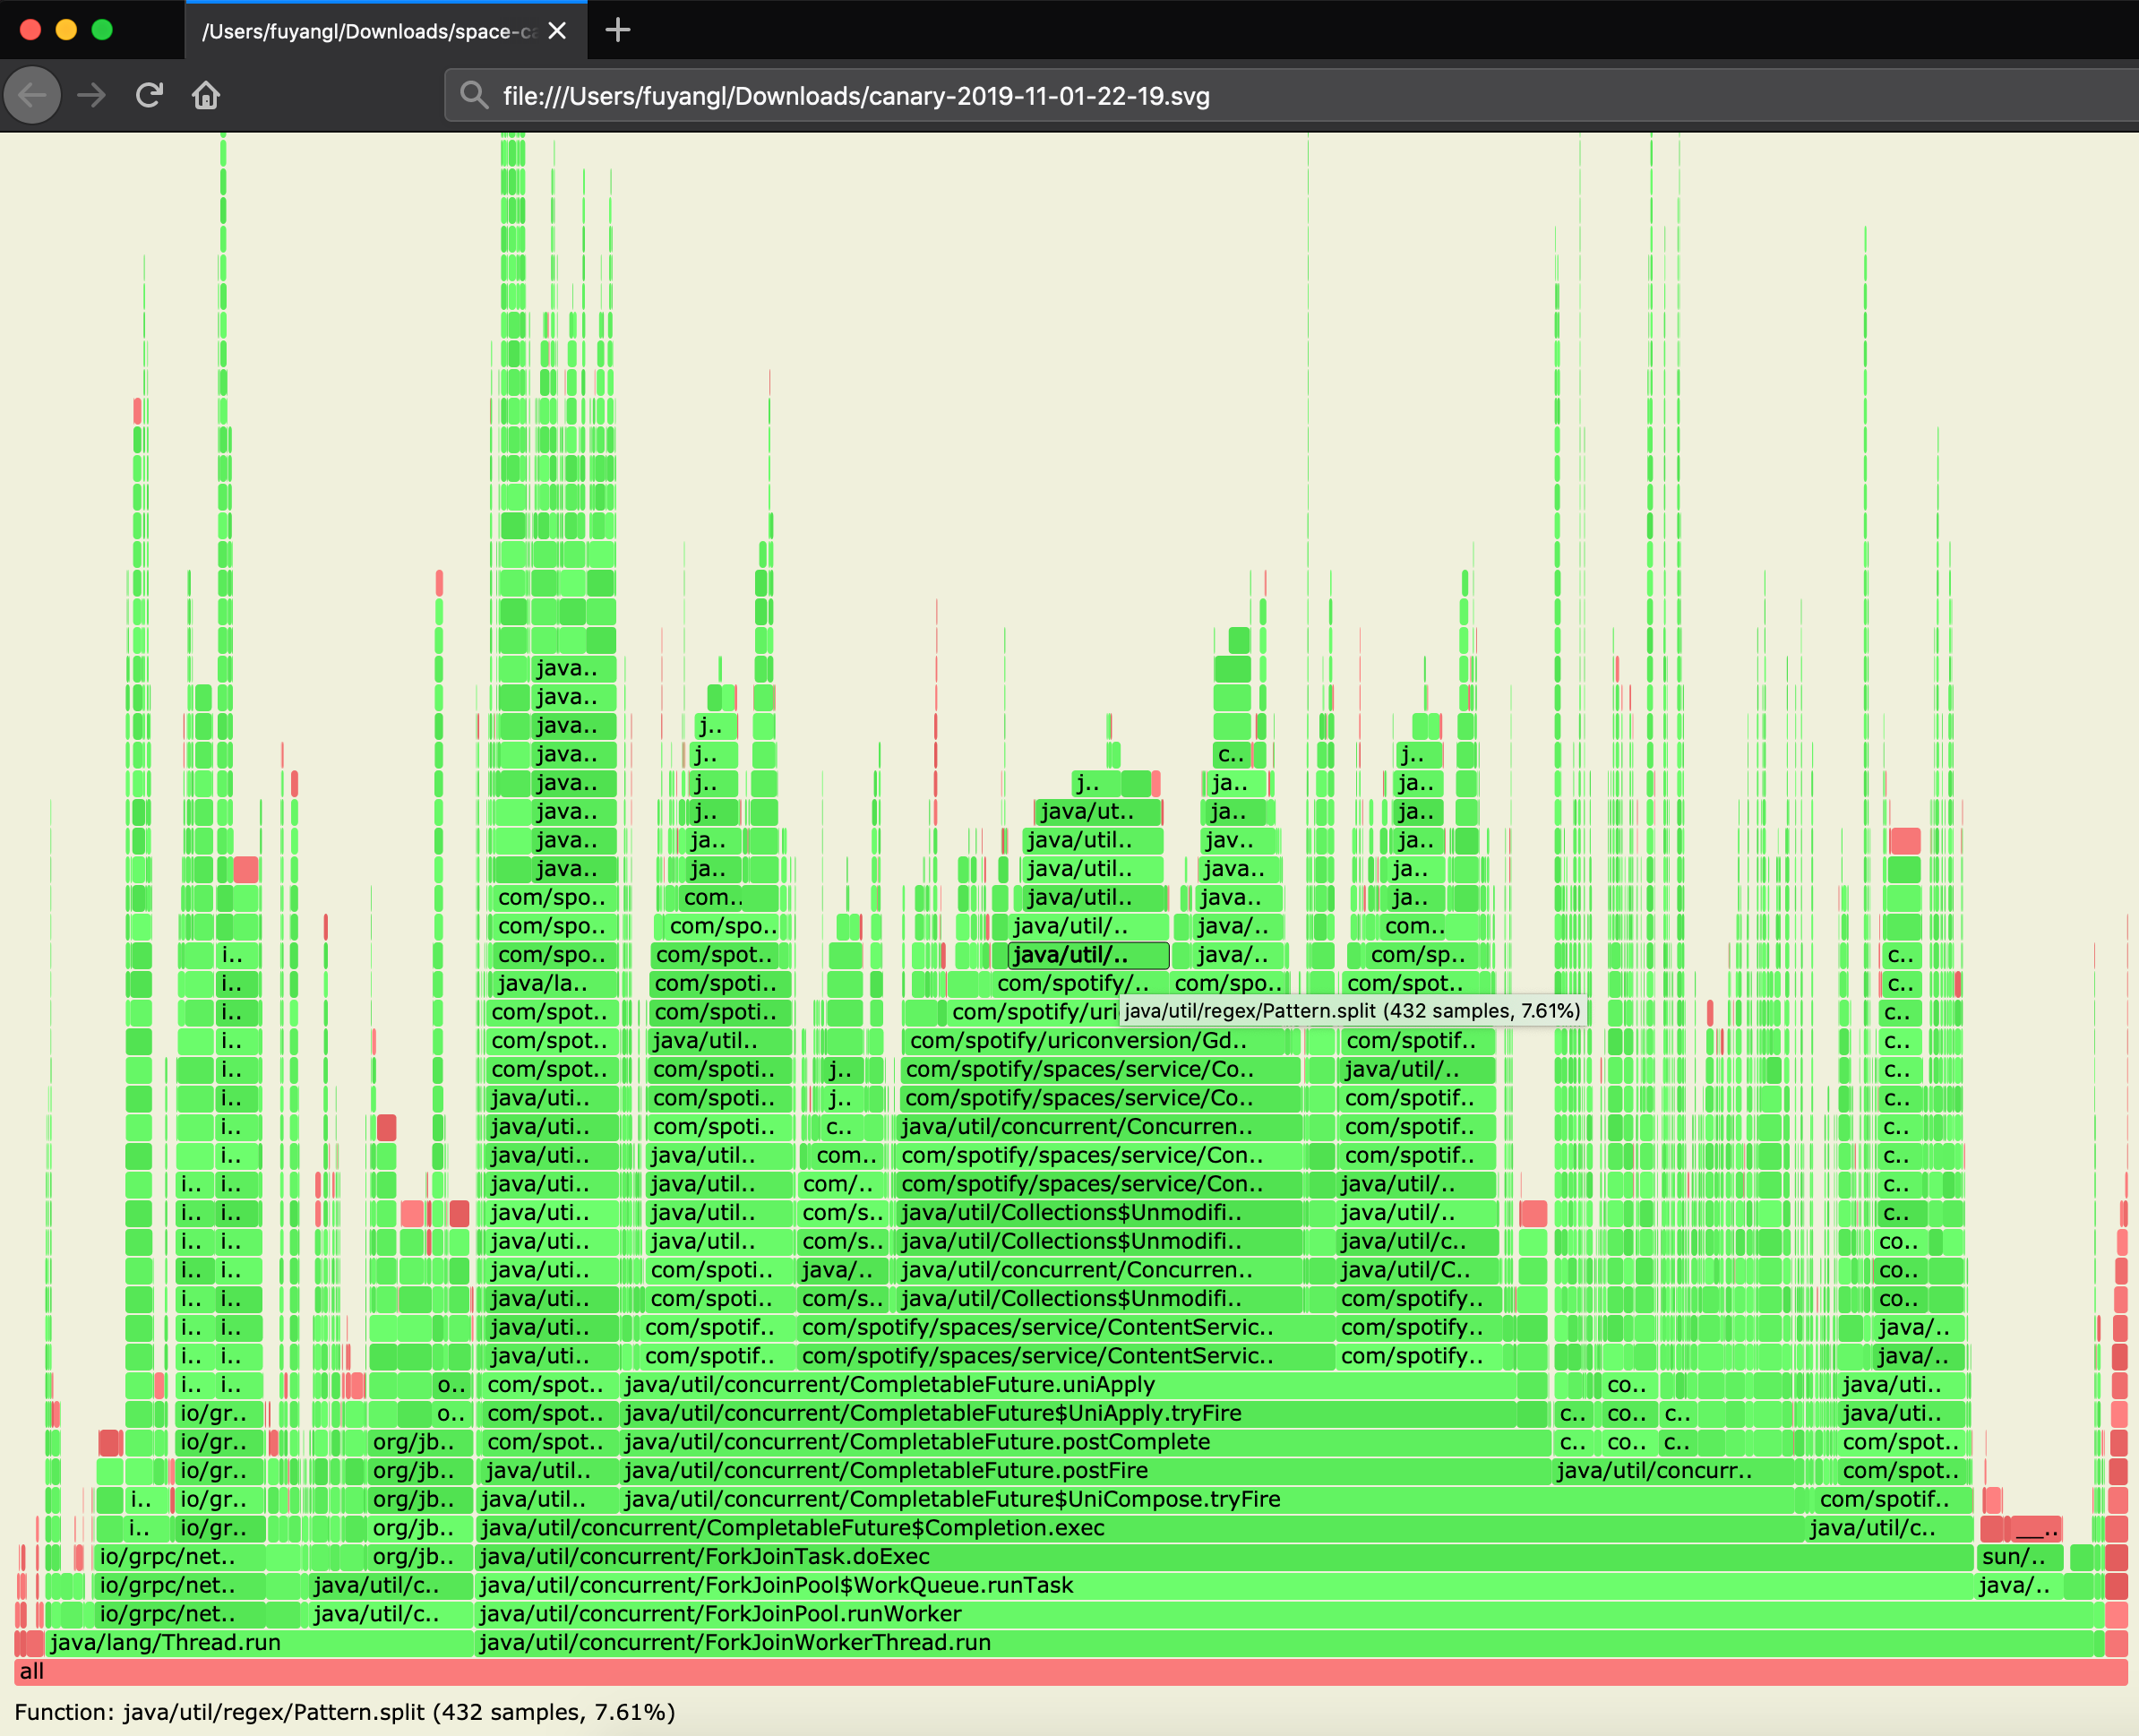
To save result to a flame graph file
./profiler.sh -d 30 -e itimer -f flamegraph.svg 10 - Then scp the file to local then you can view it in browser
Later on I will try figure out how to use it to profile memory and thread related info. But do read the official doc, it is quite helpful.
Let me know whether this helps you :)